FLEXIBILITY WITHOUT LIMITS
The functional versatility of enerchart leaves nothing to be desired. You will be surprised by the extremely flexible dashboards, use the multi-client capability to integrate your own customers into the system, automatically read practically every connectable meter, simplify manual readings with the corresponding mobile app, enjoy a true cross-vendor LoRaWAN integration, or seamlessly integrate enerchart into your product portfolio thanks to its rebranding capability.
PRESENTATION
With the dashboard construction kit, you have free placement options for numerous elements (charts, individual values, pictures, maps, embedded websites, etc.) and create highly individualized dashboards in a playful way. You can place the dashboards in an automatic slideshow for regular presentations and clear evaluations or distribute the dashboards regularly with always up-to-date energy values or key figures as a PDF file via e-mail. An unlimited number of dashboards, slideshows, and recipients (groups) can be created.
MONITORING AND CONTROL
At the level of meter connection and imports, you can have the correct and regular receipt of your measured values monitored. An alarm notifies you when incomplete or implausible values are received. Numerous mechanisms are available for subsequent correction. At the analysis level, you can also have real and virtual measuring points checked for compliance with a threshold value corridor or for unusual growth. In addition to notifications, actuators can also be switched on/off automatically.
DATA EXPORT
enerchart is an open system. You have full access to your data at any time and can also make it available to third-party systems for further processing. On an analysis level, you can export each chart’s data in CSV format with just one click. For comprehensive data exports and permanent data connections, you can also enter at the database level and create an individual interface (SQL view) for your export.
ANALYSIS AND VISUALIZATION
For the visualization of the energetic data flows, various diagram types (charts) are available. Use lines, columns, raster charts, scatter charts, as well as Sankey flows and other forms of presentation, to examine and compare your time series. The possibilities for customization regarding time selection, presentation and interaction are almost unlimited. When mapping your measurement infrastructure, it is also possible to create and display calculated (virtual) measurement points.
DATA COLLECTION
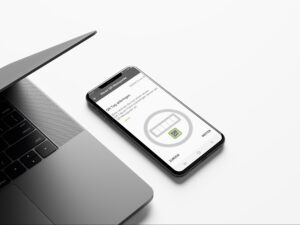
In addition to the typical energy-related data (consumption, power, voltage, …) you can record and evaluate all conceivable data and units (temperature, humidity, noise, levels, costs …). This helps with key figures and with generating non-energy-related added value. For data that cannot be entered automatically, enerchart offers input masks, upload interfaces (Excel, CSV, MSCONS, XML, …) and a mobile app for meter recording with numerous additional functions.
FURTHER CHARACTERISTICS
enerchart is particularly interesting for large and complex infrastructures: it supports multiple application languages (extensible) and can consolidate a large number of globally distributed branches. For user management, enerchart docks on request to the company’s LDAP or Active Directory (even partially), fits into the company’s IT security strategy and offers the in-house system administration numerous possibilities for control and monitoring without presenting them with new challenges. An extended overview of enerchart’s functionalities can be found in the PDF document provided here.
ENERGY MANAGEMENT
The functions for energy management according to ISO 50001 support you in many tasks in your management cycle. You can document measures, check their success or verify them by measurements, and store files and define dynamic conversions such as tariffs. The freely definable weekly schedules and annual calendars help you to synchronize your energy management with the true load situation (e.g., shift schedules, holidays, etc.).
DATA CONNECTIONS
The variety of connections and interfaces has always been enerchart’s greatest strength: the system can integrate all energy meters and sensors that have the ability to be networked into the system. With its modular architecture, connections for non-standardized interfaces can be implemented quickly and with little effort. Interface drivers already exist for practically all common standards (e.g., Modbus TCP, OPC UA, SNMP, FTP, KNX, …) and for numerous devices and data loggers (e.g., Janitza, EMU, …). Our portfolio of drivers for APIs and backends of IoT clouds (The Things Network, Loriot, NB-IoT, Sigfox, Chirpstack, …) is also growing rapidly. To realize true cross-vendor LoRaWAN integration, enerchart brings its own LoRa payload parser.


